Short Answer
Construct a boxplot for the given data. Include values of the 5-number summary in all boxplots.
-The weekly salaries (in dollars) of 24 randomly selected employees of a company are shown below. Construct a boxplot for the data set.
A)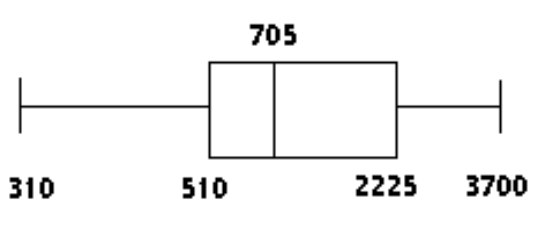
B)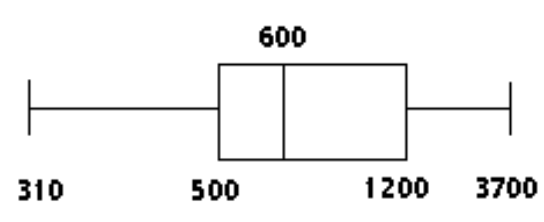
C)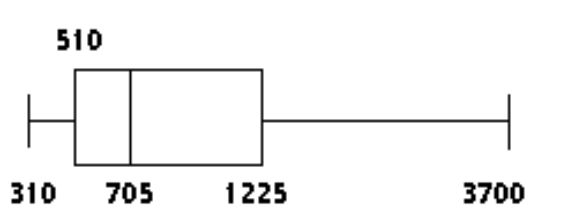
D)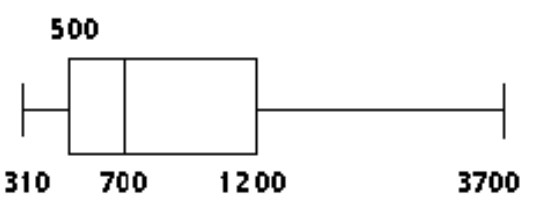
Correct Answer:

Verified
Correct Answer:
Verified
Related Questions
Q19: Provide an appropriate response.<br>-The median of a
Q88: Find the percentile for the data
Q89: Find the mean of the data
Q90: Find the standard deviation for the
Q91: The geometric mean is often used in
Q92: Find the range for the given
Q94: Find the mean for the given
Q95: Find the range for the given
Q96: The weights (in ounces) of 14
Q97: <span class="ql-formula" data-value="\begin{array}{l}\text { The test scores