Short Answer
Construct a boxplot for the given data. Include values of the 5-number summary in all boxplots.
-The highest temperatures ever recorded (in °F) in 32 different U.S. states are shown below. Construct a boxplot for the data set.
A)
B)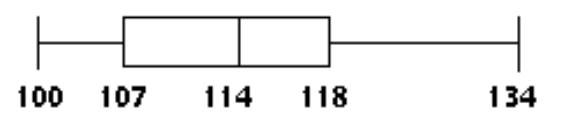
C)
D)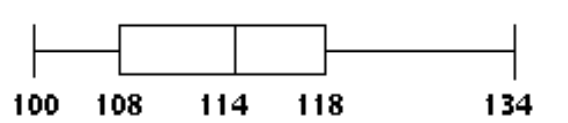
Correct Answer:

Verified
Correct Answer:
Verified
Related Questions
Q161: Find the standard deviation of the
Q162: Find the range for the given
Q163: Construct a boxplot for the given
Q164: For any data set of n
Q165: The data set below consists of
Q167: Find the coefficient of variation for
Q168: Find the mean of the data
Q169: A student earned grades of
Q170: Find the mean for the given
Q171: Find the percentile for the data