Essay
A television manufacturer sold three times as many televisions in 2005 as it did in 1995. To illustrate this fact, the manufacturer draws a graph as shown below. The television on the right is three times as tall and three times as wide as the television on the left. Why is this graph misleading? What visual impression is created by the graph? 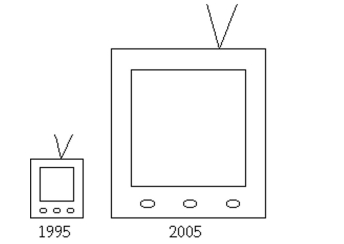
Correct Answer:

Verified
The area of the television on the right ...View Answer
Unlock this answer now
Get Access to more Verified Answers free of charge
Correct Answer:
Verified
View Answer
Unlock this answer now
Get Access to more Verified Answers free of charge
Q15: Solve the problem.<br>-Suppose that you construct a
Q54: Use the data to create a
Q55: The data shows the roundtrip mileage
Q56: The following frequency distribution analyzes the
Q57: 300 casino patrons, were interviewed as they
Q58: The weights of 22 members of
Q60: The following frequency distribution analyzes the
Q61: The normal monthly precipitation (in inches)
Q62: A manufacturer records the number of
Q63: Using a strict interpretation of the