Multiple Choice
The histogram below represents the number of television sets per household for a sample of U.S. households. What is the class width? 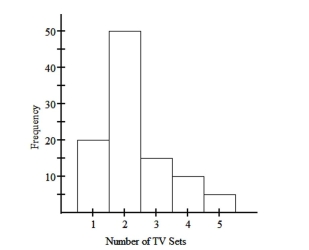
A) 0.5
B) 5
C) 1
D) 2
Correct Answer:

Verified
Correct Answer:
Verified
Related Questions
Q38: Solve the problem.<br>-Construct a frequency distribution and
Q48: The scores on a recent statistics
Q49: The frequency distribution for the weekly
Q50: A nurse measured the blood pressure of
Q51: Use the given data to construct
Q53: One purpose of displaying data graphically
Q54: Use the data to create a
Q55: The data shows the roundtrip mileage
Q56: The following frequency distribution analyzes the
Q57: 300 casino patrons, were interviewed as they