Multiple Choice
Construct a pie chart representing the given data set.
-The following data give the distribution of the types of houses in a town containing 43,000 houses.

A) 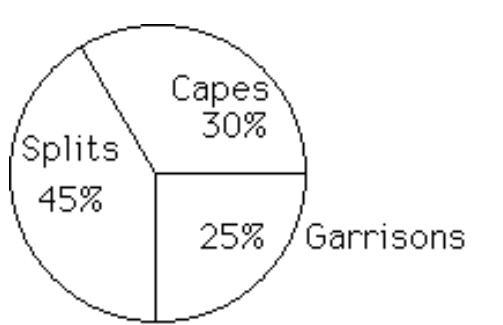
B) 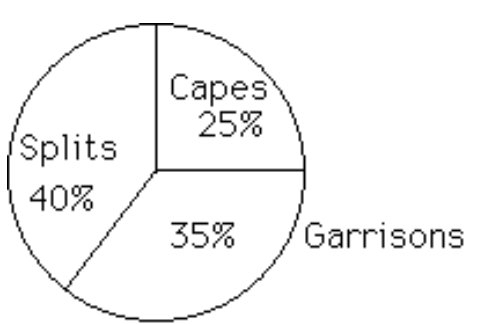
Correct Answer:

Verified
Correct Answer:
Verified
Related Questions
Q19: The frequency distribution below summarizes the
Q20: The Kappa Iota Sigma Fraternity polled its
Q21: The histogram below represents the number of
Q22: Construct the cumulative frequency distribution that
Q23: A nurse measured the blood pressure of
Q25: The graph below shows the number of
Q26: The frequency distribution below summarizes employee
Q28: On a math test, the scores
Q29: Use the high closing values of
Q50: Explain in your own words why a