Multiple Choice
The following scatterplot shows the percentage of the vote a candidate received in the 2004 senatorial elections according to the voter's income level based on an exit poll of voters conducted by CNN. The income levels 1-8 correspond to the following income classes: Under ; or more.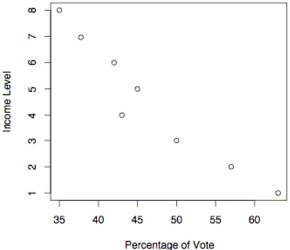
-Use the election scatterplot to the find the value of the rank correlation coefficient .
A)
B)
C)
D)
Correct Answer:

Verified
Correct Answer:
Verified
Q38: Describe the rank correlation test. What types
Q45: Use the rank correlation coefficient to
Q46: Is the data point, P, an outlier,
Q48: Describe the error in the stated conclusion.<br>-Given:
Q49: <span class="ql-formula" data-value="\begin{array} { r | r
Q51: Given the linear correlation coefficient r
Q52: When performing a rank correlation test,
Q53: For the data below, determine the
Q54: A set of data consists of
Q55: Use the given data to find