Essay
Here are data about the average January low temperature in cities in the United States, and factors that might allow us to
predict temperature. The data, available for 55 cities, include: 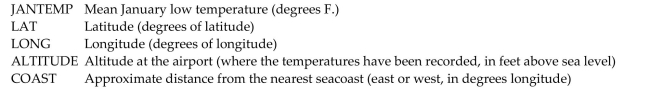 We will attempt to make a regression model to help account for mean January temperature and to understand the effects of
the various predictors.
At each step of the analysis you may assume that things learned earlier in the process are known.
Units Note: The "degrees" of temperature, given here on the Fahrenheit scale, have only coincidental language relationship to
the "degrees" of longitude and latitude. The geographic "degrees" are based on modeling the Earth as a sphere and dividing it
up into 360 degrees for a full circle. Thus 180 degrees of longitude is halfway around the world from Greenwich, England
(0°) and Latitude increases from 0 degrees at the Equator to 90 degrees of (North) latitude at the North Pole. 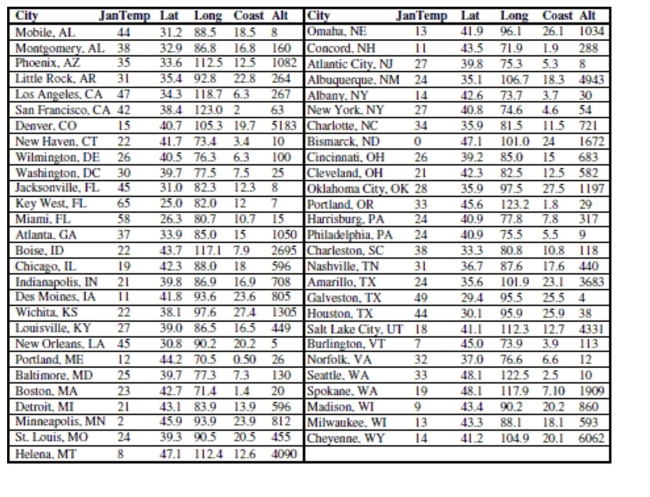
-It is possible that the distance that a city is from the ocean could affect its average January
low temperature. Coast gives an approximate distance of each city from the East Coast or
West Coast (whichever is nearer). Including it in the regression yields the following
regression table: Dependent variable is:JanTemp
R squared squared (adjusted) with degrees of freedom
And here is a scatterplot of the residuals: 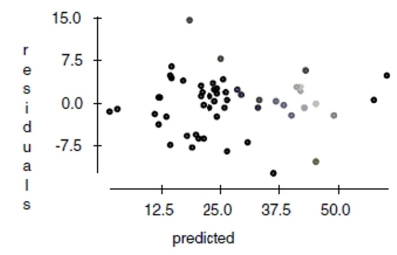
Correct Answer:

Verified
Correct Answer:
Verified
Q1: For a class project, students tested
Q3: Here are data about the average
Q4: When a sum of squares is divided
Q5: Here are data about the average
Q6: The regression below predicts the daily
Q7: In regression an observation has high leverage
Q8: In ANOVA, the Bonferroni method is used
Q9: The regression below predicts the daily
Q10: To discourage cheating, a professor makes
Q11: Homelessness is a problem in many