Essay
Here are data about the average January low temperature in cities in the United States, and factors that might allow us to
predict temperature. The data, available for 55 cities, include: 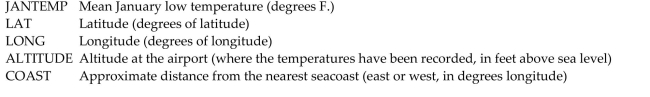 We will attempt to make a regression model to help account for mean January temperature and to understand the effects of
the various predictors.
At each step of the analysis you may assume that things learned earlier in the process are known.
Units Note: The "degrees" of temperature, given here on the Fahrenheit scale, have only coincidental language relationship to
the "degrees" of longitude and latitude. The geographic "degrees" are based on modeling the Earth as a sphere and dividing it
up into 360 degrees for a full circle. Thus 180 degrees of longitude is halfway around the world from Greenwich, England
(0°) and Latitude increases from 0 degrees at the Equator to 90 degrees of (North) latitude at the North Pole. 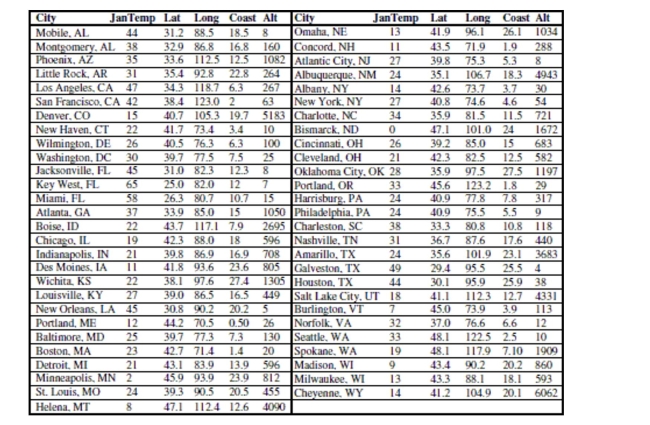
-Here is a partial regression plot for the coefficient of Long in the regression with a least
squares regression line added to the display: 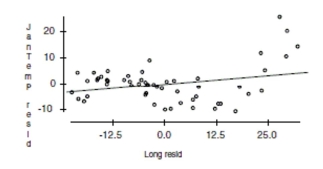
What is the slope of the line on this display? Does the display suggest that this slope
adequately summarizes the effect of longitude in the regression? Why/Why not?
Correct Answer:

Verified
The slope of a partial regression plot i...View Answer
Unlock this answer now
Get Access to more Verified Answers free of charge
Correct Answer:
Verified
View Answer
Unlock this answer now
Get Access to more Verified Answers free of charge
Q15: Three brands of AAA batteries are
Q16: A student wants to build a
Q17: The problem of collinearity occurs when<br>A) at
Q18: The regression below predicts the daily
Q19: Here are data about the average
Q22: Engineers want to know what factors
Q24: In ANOVA, an interaction between two factors
Q25: Here are data about the average January
Q34: Of the 23 first year male
Q38: Of the 23 first year male