Short Answer
The bigger the stop sign, the more expensive it is. Here is a graph of the height of a sign in inches versus its cost in dollars.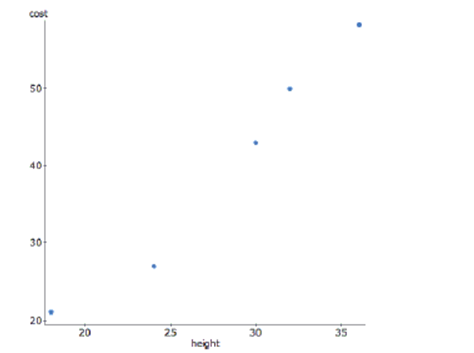
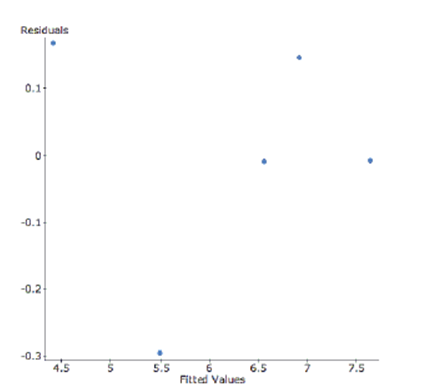
To achieve linearity, the data was transformed using a square root function of cost. Here are the results and a residual plot.Dependent Variable: sqrt(cost)
(correlation coefficient)
s: 0.2141
-Write the transformed regression equation. Make sure to define any variables used in your equation.
Correct Answer:

Verified
sqrt = 1.1...
View Answer
Unlock this answer now
Get Access to more Verified Answers free of charge
Correct Answer:
Verified
View Answer
Unlock this answer now
Get Access to more Verified Answers free of charge
Q9: Do you think a linear model is
Q140: An 8th grade class develops a linear
Q141: The correlation between X and Y is
Q142: If the point in the upper left
Q144: The bigger the stop sign, the
Q145: Carbon dating QuarkNet, a project funded
Q146: Medical records indicate that people with more
Q148: The price of first class stamp has
Q149: Which statement about influential points is true?<br>I.
Q150: After conducting a survey at a pet