Essay
The following is a scatterplot of the average final exam score versus midterm score for 11
sections of an introductory statistics class: 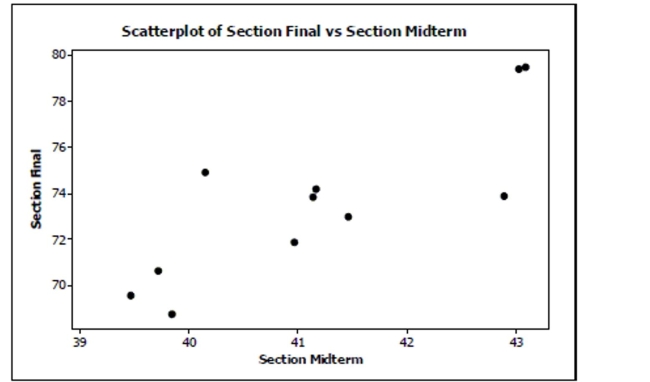
The correlation coefficient for these data is
29. If you had a scatterplot of the final
exam score versus midterm score for all individual students in this introductory statistics
course, would the correlation coefficient be weaker, stronger, or about the same? Explain.
Correct Answer:

Verified
Relationships based on averages have hig...View Answer
Unlock this answer now
Get Access to more Verified Answers free of charge
Correct Answer:
Verified
View Answer
Unlock this answer now
Get Access to more Verified Answers free of charge
Q12: Interpret the slope of your model in
Q13: During a science lab, students heated
Q14: Two variables that are actually not related
Q18: If r = -0.4 for the
Q19: It takes a while for new
Q21: Which is true?<br>I. Random scatter in the
Q24: After conducting a marketing study to see
Q57: Halloween is a fun night. It
Q136: Baseball coaches use a radar gun to
Q147: The bigger the stop sign, the