Multiple Choice
The standard deviation of the data displayed in this dotplot is closest to… 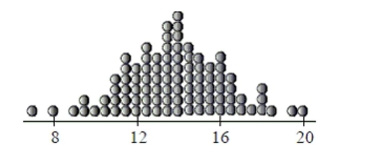
A) 2.
B) 4.
C) 1.
D) 3.5.
E) 0.5.
Correct Answer:

Verified
Correct Answer:
Verified
Related Questions
Q14: To determine if people's preference in dogs
Q23: A research company frequently monitors trends
Q56: We might choose to display data with
Q57: A company's manufacturing process uses 500 gallons
Q59: Soft drinks A restaurant owner wanted to
Q61: One thousand students from a local university
Q63: The distribution below is the number of
Q64: There are 18 roller coasters in
Q65: Veterinary costs Costs for standard veterinary services
Q106: The lifespans of a particular brand of