Multiple Choice
The standard deviation of the data displayed in this dotplot is most likely to be … 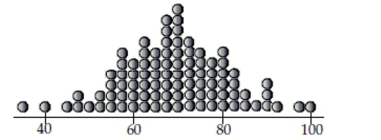
A) 8.
B) 5.
C) 20.
D) 12.
E) 18.
Correct Answer:

Verified
Correct Answer:
Verified
Related Questions
Q5: Adult female Dalmatians weigh an average of
Q18: During a budget meeting, local school
Q19: School administrators collect data on students attending
Q21: Has the percentage of young girls drinking
Q22: Consider the following part of a
Q23: A research company frequently monitors trends
Q25: The five-number summary for the weights
Q25: Has the percentage of young girls drinking
Q28: In November 2003 Discover published an article
Q64: Write a sentence or two about the