Multiple Choice
Which is true of the data shown in the histogram? 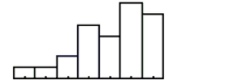 I. The distribution is skewed to the right.
II) The mean is probably smaller than the median.
III) We should use median and IQR to summarize these data.
A) I, II, and III
B) II only
C) I only
D) III only
E) II and III
Correct Answer:

Verified
Correct Answer:
Verified
Related Questions
Q3: On Monday, a class of students took
Q10: In June 2003 Consumer Reports published an
Q25: In order to plan transportation and
Q31: Which of the following variables would most
Q32: City planners wanted to know how
Q34: Suppose that the student taking 22 credit
Q35: Environmental researchers have collected rain acidity data
Q38: Auto insurance The Insurance Institute for
Q39: Which type of plot would be most
Q40: Owners of a minor league baseball team