Essay
Commuting to work The table shows how a company's employees commute to work. 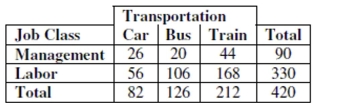
a. What is the marginal distribution (in %) of mode of transportation (Car, Bus, Train)?
b. What is the conditional distribution (in %) of mode of transportation (Car, Bus, Train) for
management?
c. What kind of display would you use to show the association between job class and mode
of transportation? (Just name a graph.)
d. Do job classification and mode of transportation appear to be independent? Give
statistical evidence to support your conclusion.
Correct Answer:

Verified
a. Car:  Bus: Train:
b. Car: Bus: Tr...View Answer
Unlock this answer now
Get Access to more Verified Answers free of charge
Correct Answer:
Verified
b. Car:
View Answer
Unlock this answer now
Get Access to more Verified Answers free of charge
Q12: Has the percentage of young girls drinking
Q20: To determine if people's preference in dogs
Q75: Suppose a Normal model describes the number
Q78: Which is true of the data whose
Q81: A survey conducted in a college
Q82: Which of these variables is most likely
Q83: Suppose that a Normal model describes the
Q84: The Wechsler Adult Intelligence Scale - Revised
Q85: Suppose that a Normal model described student
Q102: There is a proposal to replace the