Essay
The side-by-side boxplots show the cumulative college GPAs for sophomores, juniors, and
seniors taking an intro stats course in Autumn 2003. 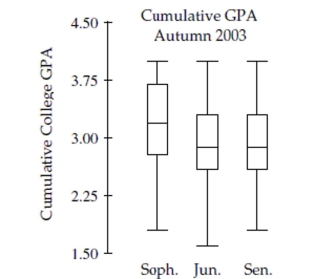
a. Which class (sophomore, junior, or senior) had the lowest cumulative college GPA?
What is the approximate value of that GPA?
b. Which class has the highest median GPA, and what is that GPA?
c. Which class has the largest range for GPA, and what is it?
d. Which class has the most symmetric set of GPAs? The most skewed set of GPAs?
Correct Answer:

Verified
a. The junior class had the lowest cumul...View Answer
Unlock this answer now
Get Access to more Verified Answers free of charge
Correct Answer:
Verified
View Answer
Unlock this answer now
Get Access to more Verified Answers free of charge
Q81: A survey conducted in a college
Q82: Which of these variables is most likely
Q83: Suppose that a Normal model describes the
Q84: The Wechsler Adult Intelligence Scale - Revised
Q85: Suppose that a Normal model described student
Q87: The boxplots show prices of used cars
Q88: The five-number summary for midterm scores
Q89: The SPCA has kept these data records
Q90: To see if your school's ACT scores
Q91: The advantage of making a stem-and-leaf display