Essay
Crawling Researchers at the University of Denver Infant Study Center investigated whether babies take longer to learn to crawl in cold months (when they are often bundled in clothes that restrict their movement) than in warmer months. The study sought an association between babies' first crawling age (in weeks) and the average temperature during the month they first try to crawl (about 6 months after birth). Between 1988 and 1991 parents reported the birth month and age at which their child was first able to creep or crawl a distance of four feet in one minute. Data were collected on 208 boys and 206 girls. The graph below plots average crawling ages (in weeks) against the mean temperatures when the babies were 6 months old. The researchers found a correlation of and their line of best fit was
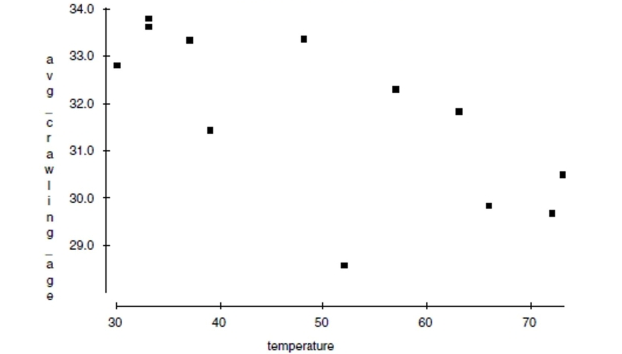
a. Draw the line of best fit on the graph. (Show your method clearly.)
b. Describe the association in context.
c. Explain (in context) what the slope of the line means.
d. Explain (in context) what the y-intercept of the line means.
e. Explain (in context) what
means.
f. In this context, what does a negative residual indicate?
Correct Answer:

Verified
a) Plot 2 points; for example (30,33.6) ...View Answer
Unlock this answer now
Get Access to more Verified Answers free of charge
Correct Answer:
Verified
View Answer
Unlock this answer now
Get Access to more Verified Answers free of charge
Q11: College admissions According to information from a
Q14: A small business just leased a new
Q34: Of the 23 first year male
Q111: The owner of a pet store is
Q639: The correlation between a family's weekly income
Q641: Suppose that a Normal model described
Q642: Which of the following statements is NOT
Q644: A basketball player has a 70% free
Q645: We are about to test a hypothesis
Q647: Which of the following is true about