Essay
Taxi tires A taxi company monitoring the safety of its cabs kept track of the number of
miles tires had been driven (in thousands) and the depth of the tread remaining (in mm).
Their data are displayed in the scatterplot. They found the equation of the least squares regression line to be tread miles, with .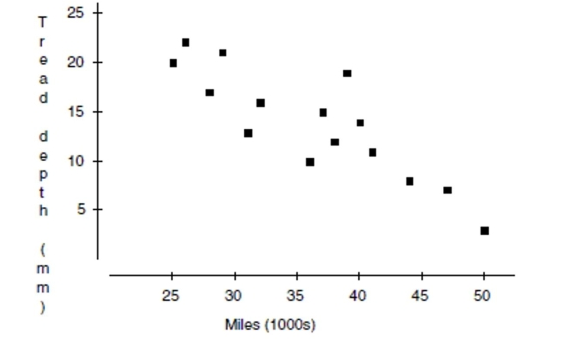
a. Draw the line of best fit on the graph. (Show your method clearly.)
b. What is the explanatory variable?
c. The correlation
d. Describe the association in context.
e. Explain (in context) what the slope of the line means.
f. Explain (in context) what the -intercept of the line means.
g. Explain (in context) what means.
h. In this context, what does a negative residual mean?
Correct Answer:

Verified
averaging 36 mm deep.
g. R2 means that 7...View Answer
Unlock this answer now
Get Access to more Verified Answers free of charge
Correct Answer:
Verified
g. R2 means that 7...
View Answer
Unlock this answer now
Get Access to more Verified Answers free of charge
Q29: A cell phone company offers a simple
Q36: A small business just leased a new
Q51: All 423 Wisconsin public schools were all
Q69: Dimes minted in the United States average
Q332: The two samples whose statistics are
Q333: Does donating blood lower cholesterol levels? 50
Q334: Could eye color be a warning signal
Q336: A researcher identified 100 men over forty
Q339: A factory has 20 assembly lines producing
Q340: The SPCA collects the following data about