Essay
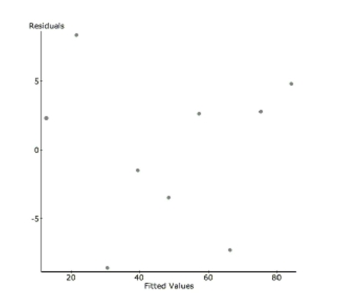
Shrimp From 1982 to 1990, there was a decrease in the number of white shrimp harvested
from the Galveston Bay. Here is the regression analysis and a residual plot. The year has
been shortened to two digits (82, 83…) and the dependent variable is the number of shrimp
collected per hour. Dependent Variable: Shrimp/hour
a. Write the regression equation and define your variables.
b. Find the correlation coefficient and interpret it in context.
c. Interpret the value of the slope in context.
d. In 1991, the shrimp production rebounded (in part due to the effects of El Nino) to 81
shrimp/hour. Find the value of this residual.
e. The prediction for 1991 was very inaccurate. What name do statisticians give to this kind
of prediction error?
Correct Answer:

Verified
a. shrimplhour  year
year
b. ; This tells us...View Answer
Unlock this answer now
Get Access to more Verified Answers free of charge
Correct Answer:
Verified
b.
View Answer
Unlock this answer now
Get Access to more Verified Answers free of charge
Q40: Too much TV? A father is concerned
Q41: Housing costs A government report on housing
Q102: Researchers plan to investigate a new medication
Q106: The lifespans of a particular brand of
Q122: Match the following descriptions with the most
Q164: The advantage of making a stem-and-leaf display
Q165: Hoping to get information that would allow
Q166: A regression analysis of students' AP*
Q168: Public opinion A member of the
Q170: Here are data about the average January