Essay
Students A growing school district tracks the student population growth over the years
from 2008 to 2013. Here are the regression results and a residual plot. students year
Sample size: 6
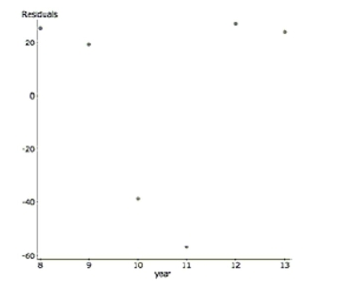
a. Explain why despite a high , this regression is not a successful model.
To linearize the data, the (base 10 ) was taken of the student population. Here are the results.
Dependent Variable: (students)
Sample size: 6
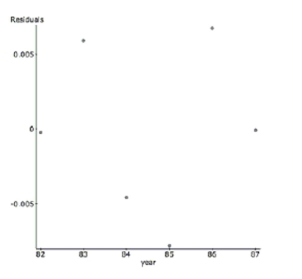
b. Describe the success of the linearization.
c. Interpret R-sq in the context of this problem.
d. Predict the student population in 2014.
Correct Answer:

Verified
a. Even though  , the residual plot has a...
View Answer
Unlock this answer now
Get Access to more Verified Answers free of charge
Correct Answer:
Verified
View Answer
Unlock this answer now
Get Access to more Verified Answers free of charge
Q10: In June 2003 Consumer Reports published an
Q20: Name and describe the kind of bias
Q105: Grape juice and blood pressure Researchers who
Q597: Researchers investigating the association between the size
Q599: Which is important in designing a good
Q603: Show three trials by clearly labeling the
Q604: Students taking an intro stats class
Q605: A researcher wants to compare the effect
Q606: Blood pressure Researchers developing new drugs
Q607: Which of these is not an advantage