Essay
The side-by-side boxplots show the cumulative college GPAs for sophomores, juniors, and
seniors taking an intro stats course in Autumn 2003. 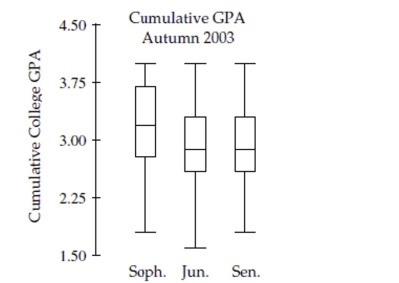
a. Which class (sophomore, junior, or senior) had the lowest cumulative college GPA?
What is the approximate value of that GPA?
b. Which class has the highest median GPA, and what is that GPA?
c. Which class has the largest range for GPA, and what is it?
d. Which class has the most symmetric set of GPAs? The most skewed set of GPAs?
Correct Answer:

Verified
a. The junior class had the lowest cumul...View Answer
Unlock this answer now
Get Access to more Verified Answers free of charge
Correct Answer:
Verified
View Answer
Unlock this answer now
Get Access to more Verified Answers free of charge
Q60: Aggressiveness A recent study evaluated elementary age
Q68: A professor at a large university
Q100: A company manufacturing computer chips finds that
Q124: Another farmer has increased his wheat production
Q405: The length of a cat's tail is
Q406: Computer output in the scenario described
Q408: The ages of people attending the opening
Q411: A business owner notes that for every
Q412: Sketch a scatterplot. <img src="https://d2lvgg3v3hfg70.cloudfront.net/TB3452/.jpg" alt="Sketch a
Q415: A Columbia University study linked soda consumption