Essay
Cats and dogs The table shows whether students in an introductory statistics class like
dogs and/or cats. 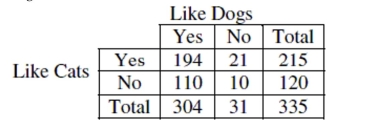
a. What is the marginal distribution (in %) of "liking dogs"?
b. What is the conditional distribution (in %) of "liking dogs" for students who like cats?
c. What kind of display(s) would you use to examine the association between "liking dogs"
and "liking cats"? (Just name a graph.)
d. Do "liking dogs" and "liking cats" appear to be independent? Give statistical evidence to
support your conclusion.
Correct Answer:

Verified
a. Yes: 90.7% No: 9.3%
b. Yes: 90.2% No:...View Answer
Unlock this answer now
Get Access to more Verified Answers free of charge
Correct Answer:
Verified
b. Yes: 90.2% No:...
View Answer
Unlock this answer now
Get Access to more Verified Answers free of charge
Q7: A college admissions counselor was interested
Q12: Interpret the slope of your model in
Q21: The board of directors for Procter and
Q28: Math and Verbal Suppose the correlation between
Q32: To determine if people's preference in
Q36: A large manufacturer of batteries knows that,
Q50: Researchers plan to investigate a new medication
Q57: Halloween is a fun night. It
Q222: The students in a biology class
Q230: Carpet A store selling carpet tracks