Multiple Choice
Which is true of the data shown in the histogram? 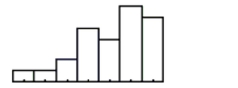 I. The distribution is skewed to the right.
II) The mean is probably smaller than the median.
III) We should use median and IQR to summarize these data.
A) I only
B) I, II, and III
C) II and III
D) II only
E) III only
Correct Answer:

Verified
Correct Answer:
Verified
Related Questions
Q9: A new clothing store advertises that
Q23: Property taxes Administrators of the fire department
Q32: A total of 23 Gossett High
Q40: Too much TV? A father is concerned
Q40: Too much TV? A father is concerned
Q57: Credit card sales The National Association of
Q176: Using the equation in number #8 again,
Q181: Time Wasted A group of students
Q183: Suppose that a manufacturer is testing
Q184: Internet access A recent Gallup poll