Multiple Choice
The standard deviation of the data displayed in this dotplot is most likely to be … 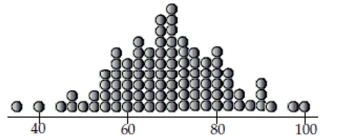
A) 18.
B) 12.
C) 5.
D) 8.
E) 20.
Correct Answer:

Verified
Correct Answer:
Verified
Related Questions
Q1: A state's Department of Education reports that
Q10: In June 2003 Consumer Reports published an
Q34: Of the 23 first year male
Q49: Graduation tests Many states mandate tests that
Q59: A small business just leased a new
Q71: Sleep Do more than 50% of U.S.
Q81: Still strange dice • The six faces
Q143: A sporting goods store announces a "Wheel
Q505: The principal of a small elementary school
Q509: A company checking the productivity of its