Multiple Choice
The standard deviation of the data displayed in this dotplot is closest to… 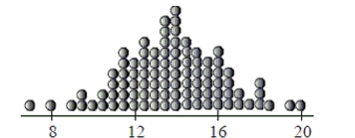
A) 0.5.
B) 3.5.
C) 1.
D) 4.
E) 2.
Correct Answer:

Verified
Correct Answer:
Verified
Related Questions
Q17: Soda cans A machine that fills cans
Q25: Has the percentage of young girls drinking
Q81: Earning power A college's job placement office
Q100: A company manufacturing computer chips finds that
Q119: Concrete thickness A roadway construction process uses
Q619: Veterinary costs Costs for standard veterinary services
Q620: Suppose that a Normal model describes the
Q624: Which of the following summaries are changed
Q625: The body temperature of students is
Q626: To see if your school's ACT scores