Essay
Auto insurance The Insurance Institute for Highway Safety publishes ratings for all
models of vehicles to compare the relative risk of payouts. 100 is the mean rating for all
vehicles. A rating of 122 means the vehicle is 22% worse than average. The table at the
right shows the summary statistics for the collision ratings of 27 midsize cars.
a. Were any of the ratings outliers? Show how you made your decision.
b. A histogram of the data is shown. Is it more appropriate to use the mean and standard
deviation, or the median and IQR to describe these data? Explain. 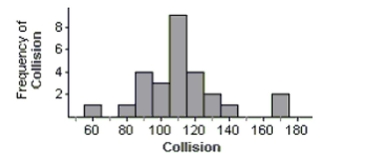
Correct Answer:

Verified
a. Yes. IQR  . The upper fence for outlie...
View Answer
Unlock this answer now
Get Access to more Verified Answers free of charge
Correct Answer:
Verified
View Answer
Unlock this answer now
Get Access to more Verified Answers free of charge
Q9: One common method of evaluating the
Q16: A statistics professor asked her students whether
Q34: Of the 23 first year male
Q85: Before you took this course, you
Q87: At an antique boat show, 90% of
Q108: College students' spending A consumer group wants
Q656: Which of these has a Geometric model?<br>A)
Q657: An ice cream stand reports that 12%
Q659: Use the equation <span class="ql-formula"
Q660: To discourage cheating, a professor makes