Multiple Choice
From the TI-84 graphing calculator screenshots below, choose the screenshot whose shaded area depicts a p-value for a two-tailed test.
A) 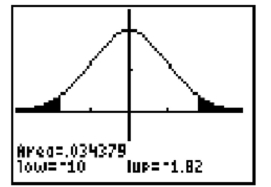
B) 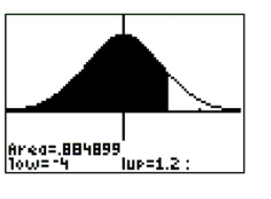
C) 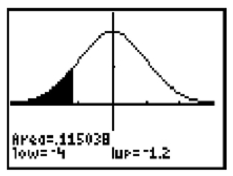
Correct Answer:

Verified
Correct Answer:
Verified
Related Questions
Q11: The janitor calculates a p-value for the
Q12: A researcher believes that the proportion
Q13: Suppose the janitor tests 300 light
Q14: The janitor calculates a p-value for the
Q15: A researcher conducts a hypothesis test on
Q17: Suppose that the following is to
Q18: A researcher believes that children who
Q19: Which of the following is not
Q21: A researcher believes that children who
Q32: List and briefly summarize the essential ingredients