Multiple Choice
From the TI-84 graphing calculator screenshots below, choose the screenshot whose shaded area correctly depicts the following hypothesis test results: -value
A) 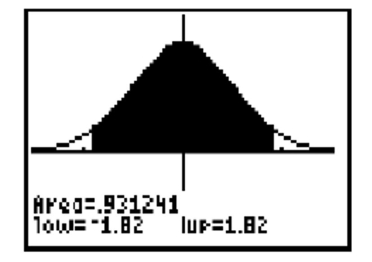
B) 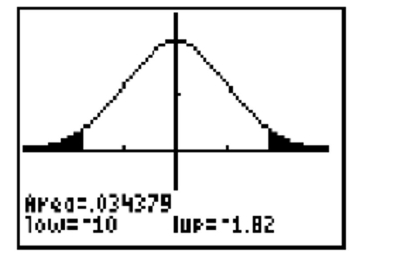
C) 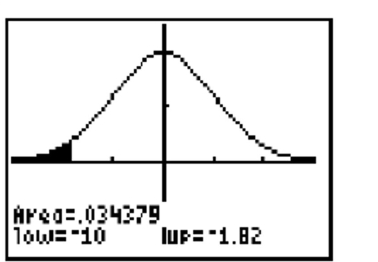
Correct Answer:

Verified
Correct Answer:
Verified
Related Questions
Q3: The worker at a carnival game claims
Q13: Which of the following is not a
Q21: List and verify that the conditions hold
Q34: Suppose the following is to be
Q35: Read the following problem description then
Q36: Read the following then choose the appropriate
Q37: Suppose that the following is to
Q42: Read the following then choose the appropriate
Q43: A researcher believes that the reading
Q48: A research firm carried out a hypothesis