Multiple Choice
The scatterplot below shows the hat size and IQ of some adults. Is the trend positive, negative, or near zero? 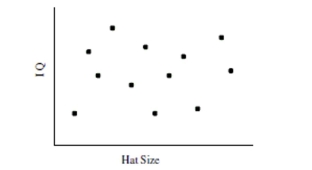
A) Positive
B) Near Zero
C) Negative
Correct Answer:

Verified
Correct Answer:
Verified
Related Questions
Q11: The scatterplot below shows the ice cream
Q12: The following regression equation was found to
Q13: It is determined that a positive
Q15: A horticulturist conducted an experiment on
Q17: Suppose that environmentalists monitor algae levels in
Q18: Doctors hypothesize that smoking cigarettes inflames the
Q20: Use the following information to answer
Q21: Doctors believe that smoking cigarettes inflames the
Q32: State the slope and intercept of the
Q42: Use the following information to answer the