Multiple Choice
The histogram below is the distribution of heights for a randomly selected Boy Scout troupe. Choose the statement that is true based on information from the histogram. 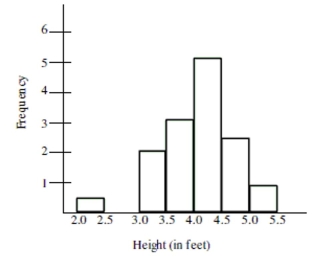
A) The smallest value is so extreme that it is possible that a mistake was made in recording the data.
B) The gap between the two smallest values indicates an outlier may be present.
C) Although the smallest value does not fit the pattern, it should not be altogether disregarded. It is Possible that the Boy Scout is 2.4 feet tall.
D) All of these are true statements.
Correct Answer:

Verified
Correct Answer:
Verified
Q4: Which of the following statements about bar
Q5: Compare and describe the shape of the
Q15: Which of the following statements about bar
Q30: Define the important features to look for
Q37: About what percent of girls spent 5
Q38: What is the mode response for 2001?<br>A)No
Q50: The distribution of test scores for a
Q58: Choose the histogram that matches the description.<br>-The
Q59: The library does not want patrons to
Q60: Choose the histogram that matches the description.<br>-The