Multiple Choice
The histogram shows the distribution of pitch speeds for a sample of 75 pitches for a college pitcher during one season. Which of the following statements best describes the distribution of the
Histogram below? 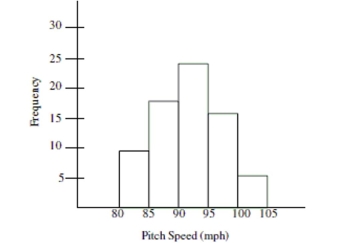
A) The distribution has a large amount of variation which can be seen by comparing the heights of the bars in the histogram.
B) The distribution is left-skewed and shows that most of the pitches were less than 95 mph.
C) The distribution is symmetric around a pitch speed of about 93 mph.
D) The distribution is right-skewed and shows that most of the pitches were more than 90 mph.
Correct Answer:

Verified
Correct Answer:
Verified
Q18: Report the mode for males and females.
Q20: Did one group (males or females)show more
Q26: Which group is more likely to spend
Q34: A used car salesman decides to track
Q38: The following graphic was used to visually
Q39: You have created a histogram showing the
Q41: For twenty days a record store owner
Q43: A collection of twenty college students
Q44: A collection of twenty college students
Q55: In which category was there more variability