Essay
Use the following information to answer the question. Below is the scatterplot showing the association between the number of workers on an assembly team (x), and the number of parts assembled in an 8- hour shift (y). The residual plot of the data is also shown along with a QQ plot of the residuals.
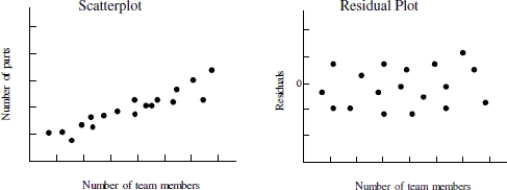
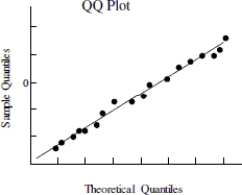
-Use the plot(s)above to explain whether the condition for normality of errors is satisfied.
Correct Answer:

Verified
The QQ plot shows a ...View Answer
Unlock this answer now
Get Access to more Verified Answers free of charge
Correct Answer:
Verified
View Answer
Unlock this answer now
Get Access to more Verified Answers free of charge
Q7: State the two conditions that must be
Q50: Use the following information to answer the
Q51: Use the following information to answer the
Q52: Use the following information to answer the
Q53: Suppose that you were presented with data
Q54: Use the following information to answer the
Q56: Use the following information to answer the
Q57: Suppose that you were presented with data
Q59: Use the following information to answer the
Q60: Choose the condition of the linear regression