Multiple Choice
Which of the following QQ plots most closely depicts data from a normally distributed population?
A) 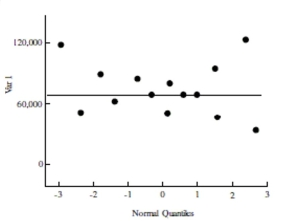
B) 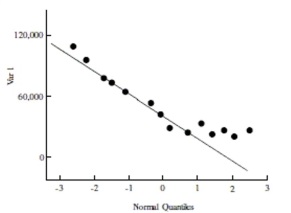
C) 
D) 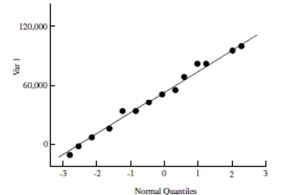
Correct Answer:

Verified
Correct Answer:
Verified
Related Questions
Q13: Use the following information to answer the
Q21: Use the following information to answer
Q22: Which of the following is an indication
Q24: Use the following information to answer
Q30: A used car lot owner wanted to
Q34: Use the following information to answer the
Q38: Which of the following is not necessarily
Q45: Use the following information to answer the
Q46: Use the following information to answer the
Q50: Use the following information to answer the