Multiple Choice
Which of the following QQ plots most closely depicts data from a skewed population?
A) 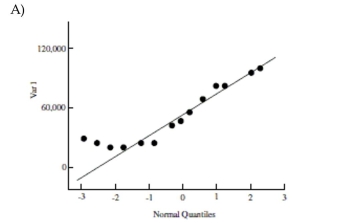
B) 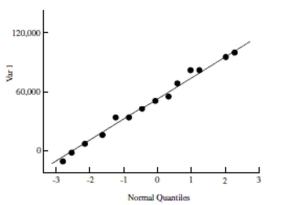
C) 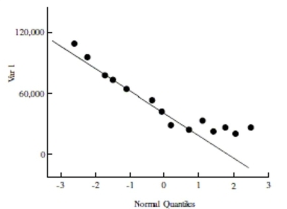
D) 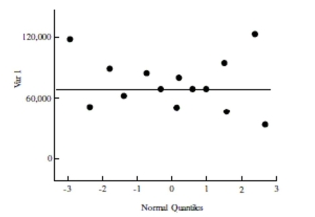
Correct Answer:

Verified
Correct Answer:
Verified
Related Questions
Q7: Use the following information to answer the
Q14: List three of the five conditions, pertaining
Q15: Use the following information to answer
Q17: A new fiber bar is advertised to
Q18: Use the following information to answer
Q21: Use the following information to answer
Q24: Use the following information to answer
Q25: Which of the following statements could be
Q46: Use the following information to answer the
Q50: Use the following information to answer the