Short Answer
Use the following information to answer the question. Suppose the manager of a large appliance and electronics store wants to estimate the amount spent by customers during the holiday season. He took a random sample of customers and recorded the amount they spent. A histogram of the data shows that the data is strongly left- skewed. The figures below show the confidence intervals for the mean amount spent using (A)raw (untransformed)data, and (B)log- transformed data, which showed a more normally distributed data set.
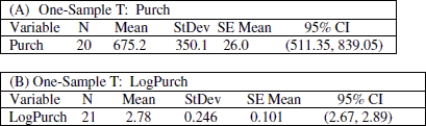
-Which interval should the manager report to the store owner about the typical amount of money spent during the holiday season? Explain.
Correct Answer:

Verified
The confidence interval for the geometri...View Answer
Unlock this answer now
Get Access to more Verified Answers free of charge
Correct Answer:
Verified
View Answer
Unlock this answer now
Get Access to more Verified Answers free of charge
Q8: Use the following information to answer the
Q9: Find the mean, median, and geometric mean
Q10: Use the following information to answer the
Q11: You are presented with data from two
Q12: Match the histogram with the corresponding QQ
Q14: Choose the statement that is not true
Q14: List three of the five conditions, pertaining
Q15: Use the following information to answer the
Q18: Use the following information to answer the
Q22: Suppose you are asked to analyze sample