Multiple Choice
The two- way table below shows teenage driver gender and whether or not the respondent had texted at least once while driving during the last thirty days.
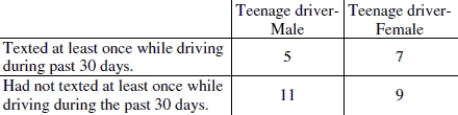
-What percentage of the sample had texted at least once while driving in the past thirty days?
A) 37.5%
B) 43.75%
C) 62.5%
D) 50%
Correct Answer:

Verified
Correct Answer:
Verified
Q45: The obesity rates of elementary age children
Q46: The ethnicity of the individual respondents in
Q47: Explain what a numerical variable is and
Q48: Suppose you are presented with a dataset
Q49: Identify the sample and the population it
Q51: The gender of a sample of adults
Q52: The deacons at a local church surveyed
Q53: The average number of hours spent completing
Q54: Marital status of each member of a
Q55: Which of the following measurements is likely