Multiple Choice
The graph in the figure shows the tensile stress as a function of the tensile strain in a certain wire. What does the slope of this graph give us for this wire?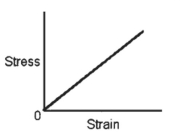
A) the pressure in the wire
B) the tensile stress in the wire
C) Young's modulus for the material of the wire
D) the tension in the wire
E) the percent change in the length of the wire
Correct Answer:

Verified
Correct Answer:
Verified
Related Questions
Q29: A 25-kg television set rests on
Q30: A shear force of 400
Q31: A stepladder consists of two halves that
Q32: A 25-kg piece of equipment can be
Q33: A light board that is 10 m
Q35: A uniform 1200-N piece of medical
Q36: A 100-kg nonuniform boom that is
Q37: Which of the following are SI
Q38: A piece of iron sinks to the
Q39: An 82-kg diver stands at the edge