Short Answer
The graph in the figure represents the velocity of a particle as it travels along the x-axis.
What is the average acceleration of the particle between t = 2.0 s and t = 4.0 s? 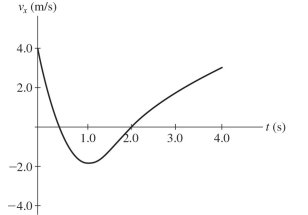
Correct Answer:

Verified
Correct Answer:
Verified
Related Questions
Q449: An object attached to an ideal spring
Q450: What is the rms current through a
Q451: Abby throws a ball straight up and
Q452: A circular coil lies flat on a
Q453: The current definition of the standard meter
Q455: If a car accelerates at a uniform
Q456: An airplane starts from rest and accelerates
Q457: Acceleration is sometimes expressed in multiples of
Q458: A guitar string is set into vibration
Q459: A heat engine having the maximum possible