Multiple Choice
The graph in the figure shows the position of a particle as it travels along the x-axis. What is the magnitude of the average velocity of the particle between t = 1.0 s and t = 4.0 s? 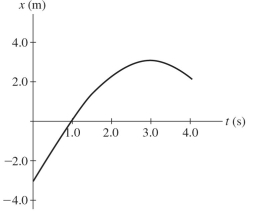
A) 0.25 m/s
B) 1.0 m/s
C) 0.67 m/s
D) 1.3 m/s
E) 0.50 m/s
Correct Answer:

Verified
Correct Answer:
Verified
Related Questions
Q13: Which of the following graphs represent an
Q14: A car starts from rest and accelerates
Q15: A resistor and an inductor are connected
Q16: A ball is thrown straight up with
Q17: When different resistors are connected in parallel
Q19: The primary of an ideal transformer has
Q20: Two taut strings of identical mass per
Q21: A fixed container holds oxygen and helium
Q22: You leave on a 549-mi trip in
Q23: Two motors in a factory are running