Multiple Choice
The graph in the figure shows the velocity of a particle as it travels along the x-axis. What is the magnitude of the average acceleration of the particle between t = 1.0 s and t = 4.0 s? 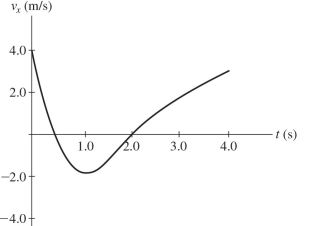
A) 
B) 
C) 
D) 
E) 
Correct Answer:

Verified
Correct Answer:
Verified
Related Questions
Q439: A baseball is hit with a bat
Q440: A person running in place on an
Q441: What is the frequency does a stationary
Q442: The lowest tone to resonate in pipe
Q443: When 5.00 A is flowing through an
Q445: Consider a brick that is totally immersed
Q446: A pendulum of length L is suspended
Q447: An object is attached to a vertical
Q448: According to Faraday's law, a coil in
Q449: An object attached to an ideal spring