Short Answer
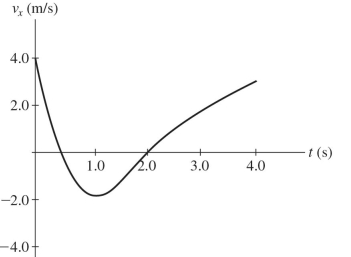
The graph in the figure shows the velocity of a particle as it travels along the x -axis. (a) In what direction (+x or -x) is the acceleration at t=0.5 s?
(b) In what direction ( +x or -x ) is the acceleration at t=3.0 s?
(c) What is the average acceleration of the particle between t=2.0 s and t=4.0 s ?
(d) At what value of t is the instantaneous acceleration equal to  ?
?
Correct Answer:

Verified
(a) -x
(b) +x
(c...View Answer
Unlock this answer now
Get Access to more Verified Answers free of charge
Correct Answer:
Verified
(b) +x
(c...
View Answer
Unlock this answer now
Get Access to more Verified Answers free of charge
Q499: Two in-phase loudspeakers are placed along a
Q500: A fixed amount of an ideal monatomic
Q501: The total mechanical energy of a simple
Q502: The potential (relative to infinity) at the
Q503: Car A is traveling at
Q505: A crane lifts a 2500-kg beam at
Q506: A proton and an electron are released
Q507: <img src="https://d2lvgg3v3hfg70.cloudfront.net/TB3818/.jpg" alt=" r is connected
Q508: In a RLC circuit, the values of
Q509: A circular coil lies flat on a