Short Answer
The figure shows a graph of the position of a moving object as a function of time.
(a) What is the average velocity of the object from t = 0 s to t = 4.0 s?
(b) What is the average velocity of the object from t = 0 s to t = 6.0 s? 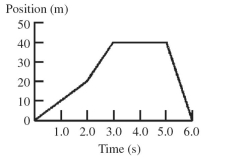
Correct Answer:

Verified
(a) 10 m/s...View Answer
Unlock this answer now
Get Access to more Verified Answers free of charge
Correct Answer:
Verified
View Answer
Unlock this answer now
Get Access to more Verified Answers free of charge
Q467: A solid cylindrical bar conducts heat at
Q468: Two loudspeakers placed 6.00 m apart are
Q469: Two in-phase loudspeakers are placed along a
Q470: If you run a complete loop around
Q471: Which of the following statements is true
Q473: A car approaches you at a constant
Q474: The figure shows a graph of the
Q475: A motorist makes a trip of 180
Q476: As more resistors are added in parallel
Q477: A plastic rod is charged up by