Multiple Choice
The figure shows a graph of the resistance of a wire as a function of its length. What physical quantities does the slope of this graph represent?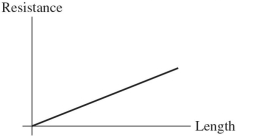
A) the product of the resistivity and the cross-sectional area of the wire
B) the reciprocal of the resistivity of the material
C) the cross-sectional area of the wire
D) the resistivity of the material of which the wire is made
E) the resistivity of the material divided by the cross-sectional area of the wire
Correct Answer:

Verified
Correct Answer:
Verified
Q71: The graph shown in the figure shows
Q72: A light bulb operating at 110
Q73: When a potential difference is applied
Q74: A battery supplies <span class="ql-formula"
Q75: A <span class="ql-formula" data-value="12 -
Q77: A total of <span class="ql-formula"
Q78: You are given a copper bar
Q79: The figure shows electrons passing through
Q80: If the power rating of a
Q81: Consider two copper wires with circular