Multiple Choice
The figure shows a graph of the power dissipated in a resistor as a function of the resistance. What quantity does the slope of this graph represent? 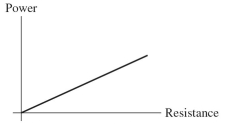
A) the square of the current in the resistor
B) the potential difference across the resistor
C) the reciprocal of the current in the resistor
D) the current in the resistor
E) the resistivity of the resistor
Correct Answer:

Verified
Correct Answer:
Verified
Related Questions
Q39: The length of a certain wire
Q40: What is the resistance of a
Q41: For the graph shown in the
Q42: How much does it cost to
Q43: If a quantity you calculated has
Q45: A resistor operated at <span
Q46: How much energy does a 100-W
Q47: The resistivity of a <span
Q48: The resistivity of the material of
Q49: Over ordinary temperature ranges, the resistance