Multiple Choice
The figure shows a diagram for mol of ideal gas that undergoes the process . The gas then undergoes an isochoric heating from point 2 until the pressure is restored to the value it had at point 1. What is the final temperature of the gas? .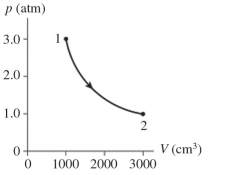
A)
B)
C)
D)
Correct Answer:

Verified
Correct Answer:
Verified
Related Questions
Q14: A monatomic ideal gas undergoes an
Q15: During each cycle, a refrigerator removes
Q16: Which of the following is a
Q17: An ideal Carnot engine is operated
Q18: An inventor tries to sell you
Q20: A coal-fired plant generates <span
Q21: A gas expands from an initial
Q22: The figure shows a <span
Q23: A gas follows the <span
Q24: The figure shows a <span