Multiple Choice
The figure shows a graph of the temperature of a pure substance as a function of time as heat is added to it at a constant rate in a closed container. If is the latent heat of fusion of this substance and is its latent heat of vaporization, what is the value of the ratio 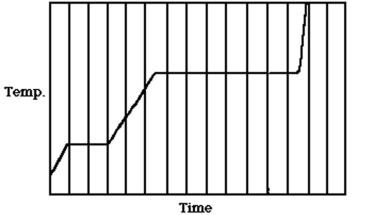
A) 4.5
B) 7.2
C) 1.5
D) 3.5
E) 5.0
Correct Answer:

Verified
Correct Answer:
Verified
Related Questions
Q77: If 50 g of lead
Q78: A giant star radiates energy at
Q79: In a flask, 114.0 g
Q80: In an electric furnace used for
Q81: Object 1 has three times the
Q83: A 600-g piece of iron
Q84: A blacksmith is flattening a steel
Q85: A lab assistant pours 330
Q86: A person is walking outdoors on
Q87: A metal has a latent heat