Multiple Choice
The figure shows a graph of the position x as a function of time t for a system undergoing simple harmonic motion. Which one of the following graphs represents the velocity of this system as a
Function of time? 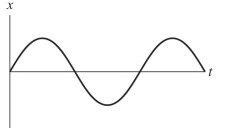
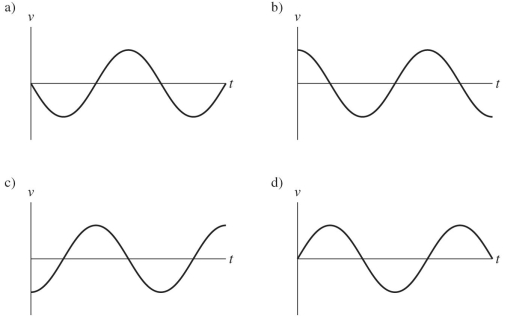
A) graph a
B) graph b
C) graph c
D) graph d
Correct Answer:

Verified
Correct Answer:
Verified
Related Questions
Q92: When a 0.350-kg package is attached to
Q93: A simple pendulum has a period T
Q94: Light from a laser forms a
Q95: Standing waves of frequency 17 Hz
Q96: A sewing machine needle moves in simple
Q98: A simple harmonic oscillator oscillates with frequency
Q99: An object oscillates such that its position
Q100: Four waves are described by the following
Q101: In a supermarket, you place a 22.3-N
Q102: A 0.16-kg block on a horizontal frictionless