Multiple Choice
The figure shows a graph of the position x as a function of time t for a system undergoing simple harmonic motion. Which one of the following graphs represents the acceleration of this system as a Function of time? 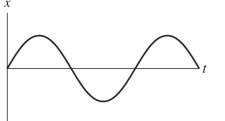
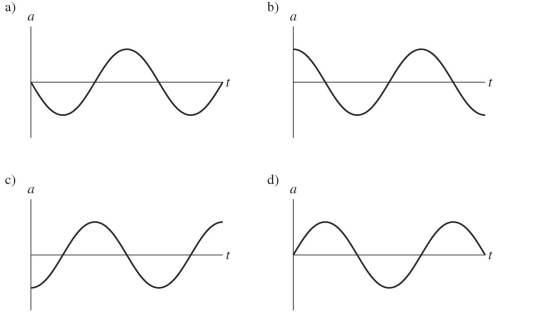
A) graph a
B) graph b
C) graph c
D) graph d
Correct Answer:

Verified
Correct Answer:
Verified
Related Questions
Q44: On the Moon, the acceleration of gravity
Q45: If a pendulum makes 12 complete swings
Q46: A 0.25 kg harmonic oscillator
Q47: A 0.150-kg air track cart is
Q48: A string of linear density 1.5
Q50: An object of mass 6.8 kg
Q51: Why does the intensity of waves from
Q52: When a guitar is tuned to adjust
Q53: The period of a simple pendulum that
Q54: If both the mass of a simple