Essay
A normal probability plot is given below for a sample of scores on an aptitude test. Use the plot to assess the normality of scores on this test. Explain your reasoning. 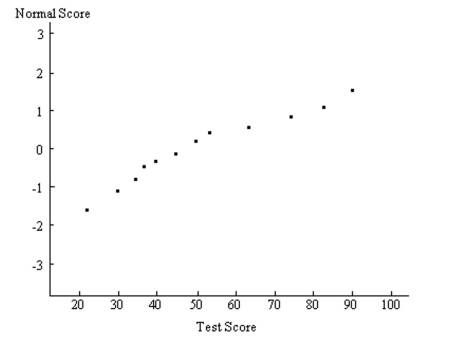
Correct Answer:

Verified
Since the normal probability p...View Answer
Unlock this answer now
Get Access to more Verified Answers free of charge
Correct Answer:
Verified
View Answer
Unlock this answer now
Get Access to more Verified Answers free of charge
Q64: Use the continuity correction and describe the
Q65: Provide an appropriate response.<br>-Sketch a brief diagram
Q66: List the different possible samples, and find
Q67: Solve the problem.<br>-A study of the amount
Q68: A poll of 1200 randomly selected students
Q70: Construct a normal probability plot of
Q71: Use the continuity correction and describe the
Q72: Scores on a test have a
Q73: The Precision Scientific Instrument Company manufactures thermometers
Q74: Identify the probability of each sample,