Essay
A normal probability plot is given below for a sample of scores on an aptitude test. Use the plot to assess the normality of scores on this test. Explain your reasoning. 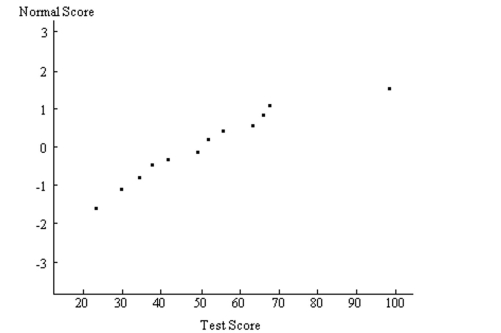
Correct Answer:

Verified
Since the normal probability p...View Answer
Unlock this answer now
Get Access to more Verified Answers free of charge
Correct Answer:
Verified
View Answer
Unlock this answer now
Get Access to more Verified Answers free of charge
Q15: A bank's loan officer rates applicants for
Q16: Use the continuity correction and describe the
Q17: Solve the problem.<br>-For women aged 18-24, systolic
Q18: Assume that the weight loss for
Q19: A poll of 1700 randomly selected students
Q21: Solve the problem.<br>-A bank's loan officer
Q22: Using the following uniform density curve, answer
Q23: Provide an appropriate response.<br>-Describe the process for
Q24: The Precision Scientific Instrument Company manufactures thermometers
Q25: In one region, the September energy consumption