Essay
A normal probability plot is given below for the weekly incomes (in dollars)of a sample of engineers in one town. Use the plot to assess the normality of the incomes of engineers in this town. Explain your reasoning. 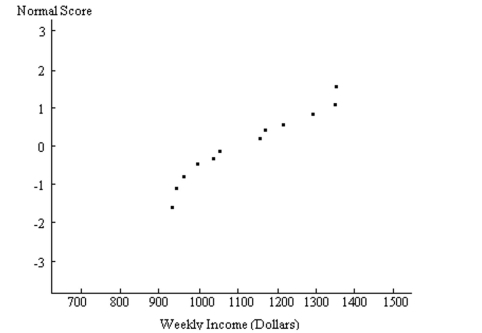
Correct Answer:

Verified
Since the normal probability plot displa...View Answer
Unlock this answer now
Get Access to more Verified Answers free of charge
Correct Answer:
Verified
View Answer
Unlock this answer now
Get Access to more Verified Answers free of charge
Q134: The lengths of human pregnancies are normally
Q135: Use the continuity correction and describe the
Q136: Merta reports that 74% of its trains
Q137: A normal probability plot is given below
Q138: Assume that the weights of quarters are
Q140: Solve the problem.<br>-Scores on an English test
Q141: Provide an appropriate response.<br>-SAT verbal scores are
Q142: In a certain population, 10% of people
Q143: Solve the problem.<br>-The annual precipitation amounts in
Q144: Solve the problem.<br>-The amount of rainfall